
Hard numbers that show where your edge actually is
Win rate, expectancy, average R-multiple, profit factor, and max drawdown — sliced by setup, session, instrument, and weekday. Stop guessing where you make money and start knowing.
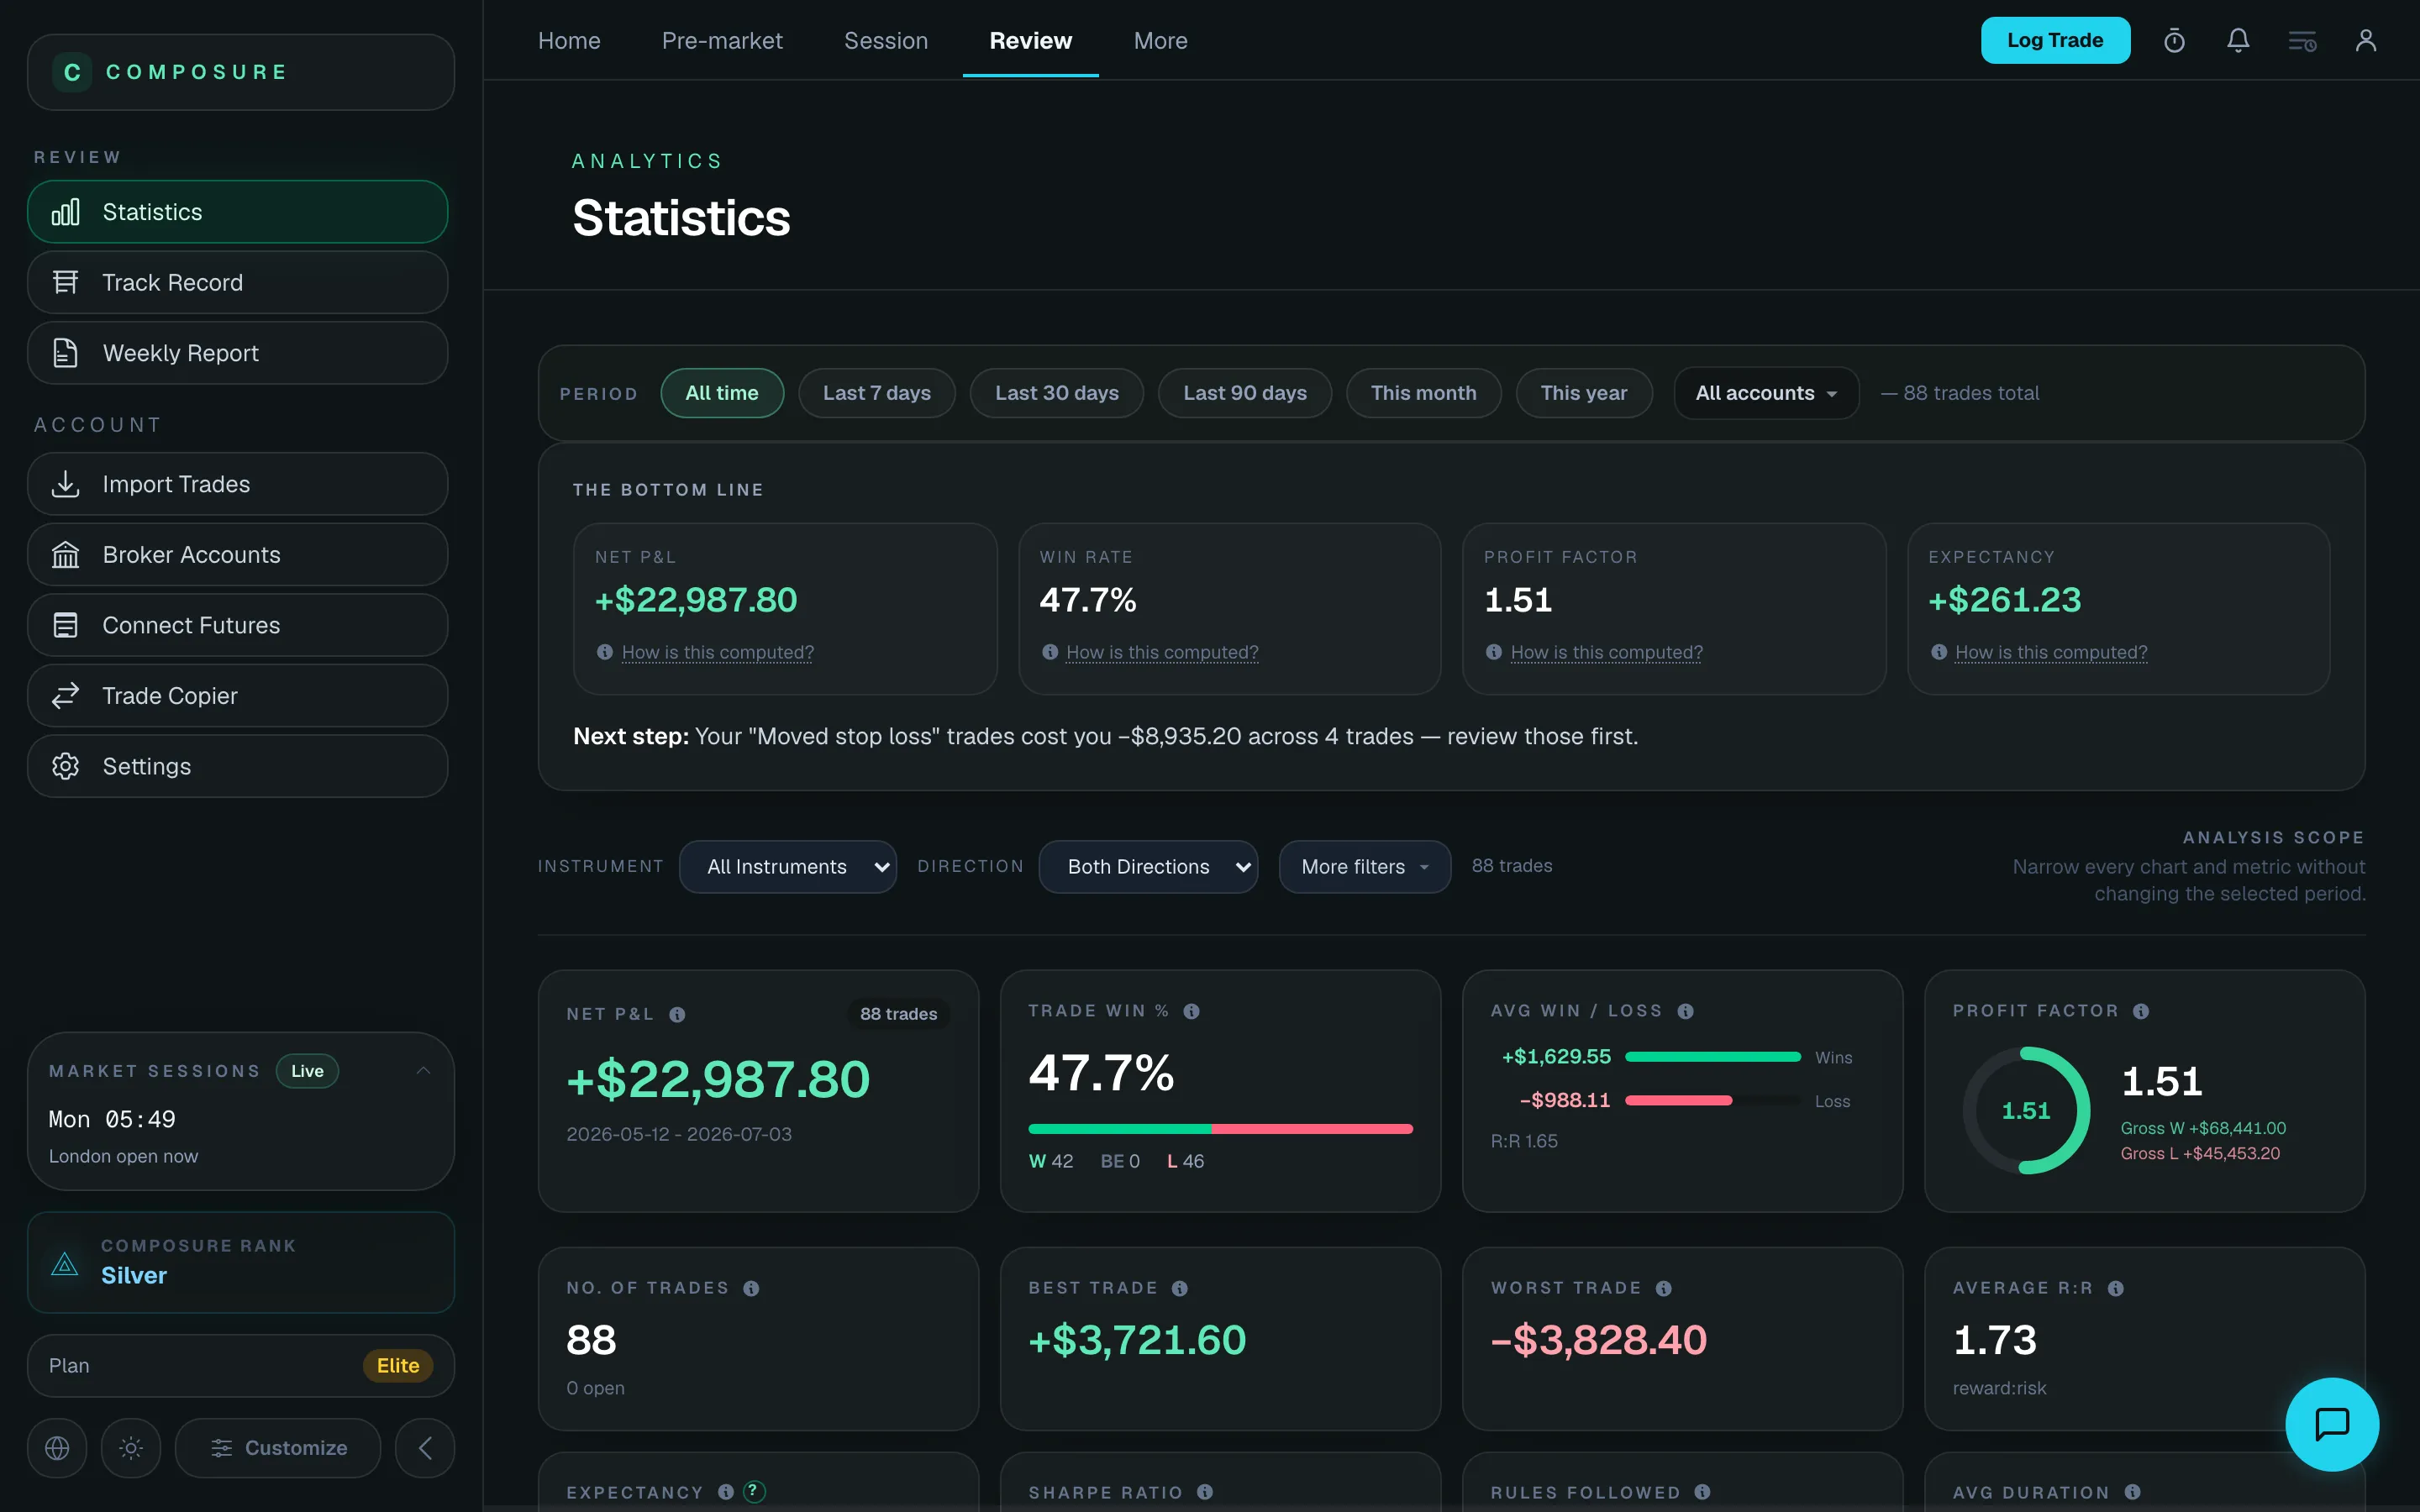
You feel like you have an edge but cannot prove it with numbers.
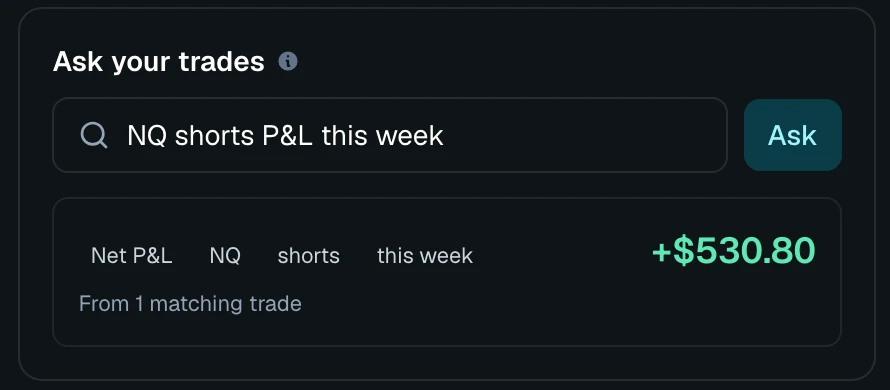
Ask in plain words — “NQ shorts P&L this week” — and the number comes back straight from your fills.
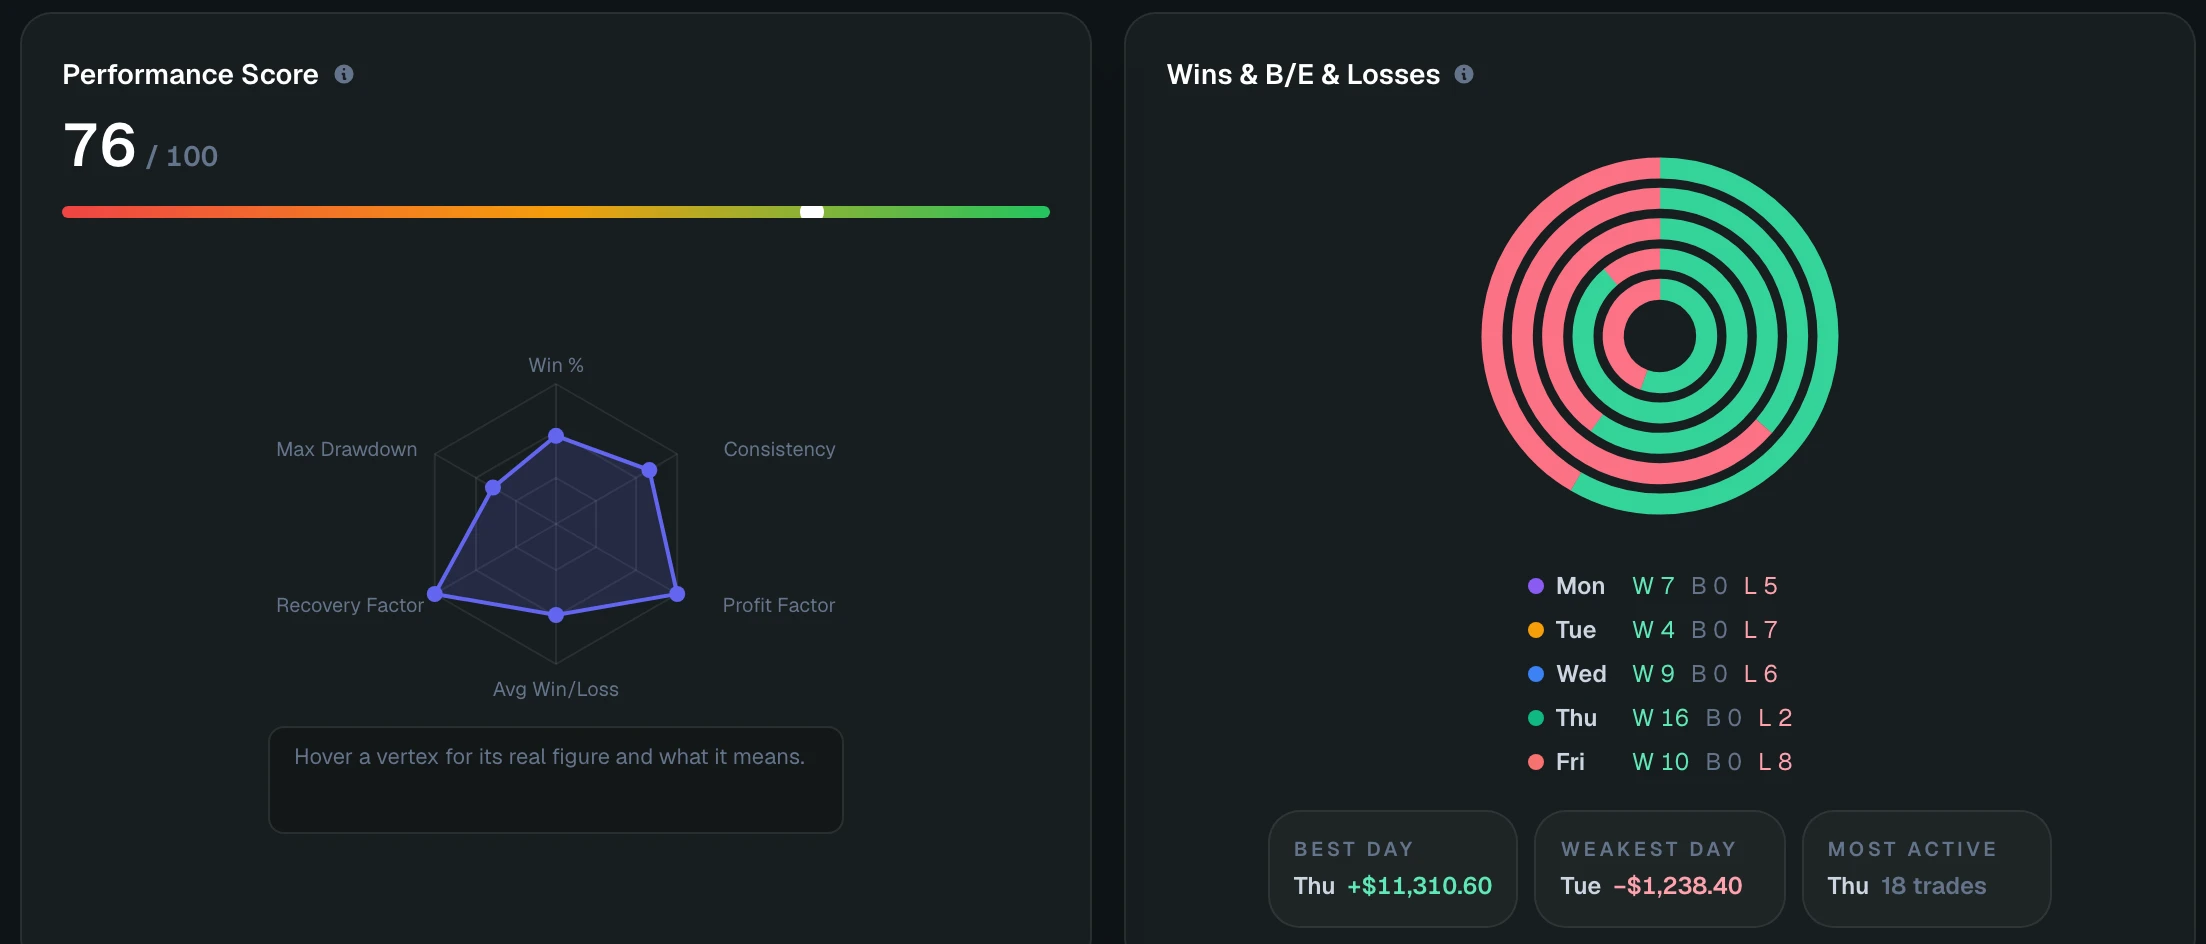
You do not know if Tuesday mornings or Friday afternoons hurt your P/L.
Edge breakdown by weekday and session reveals exactly when you perform.
Your win rate looks fine but your account still bleeds.
Average R-multiple and profit factor expose whether your wins are actually bigger than your losses.

Written from real data
Explore the live demo →75
trades analysed
+$19,199
net P&L journaled
63%
win rate tracked
2.18
profit factor computed












Sample account figures — illustrative, not real trading results. Platform names are used for identification only.
Why ours wins
What typical journals do — and what Composure does instead
Free forever. No credit card. Your data stays private.